OLED Lifetime Estimation
Operatiion Liifetiime Estiimatiion
• OLED operation lifetime
◇ Definition
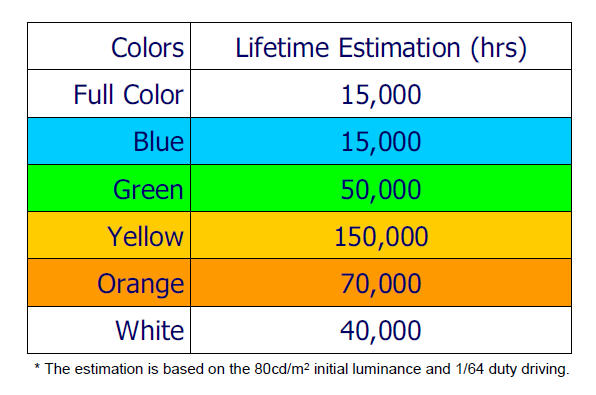
◇ Test result for each colors
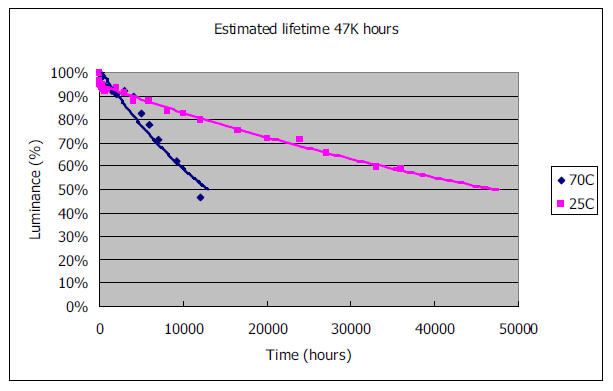
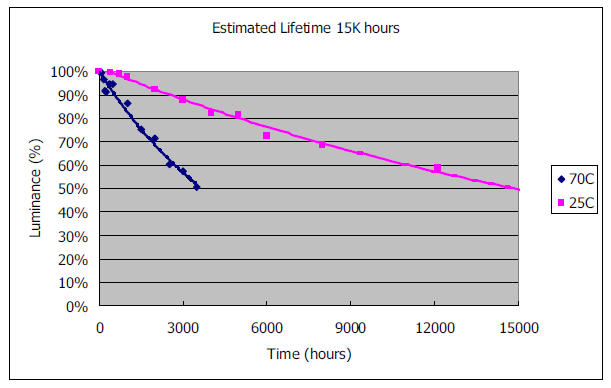
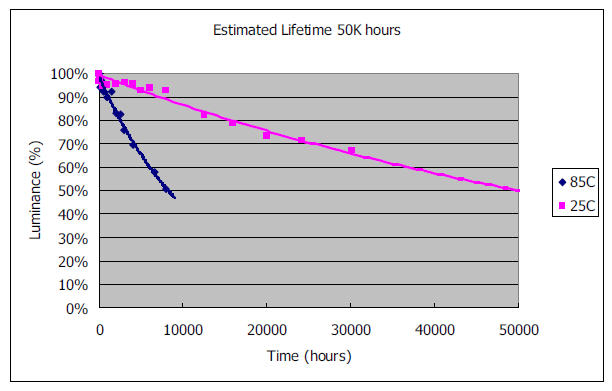
◇ Lifetime estimation result
• Effective factors with the OLED lifetime
• Trend for the lifetime evaluation
◇ Lighting efficiency affect to the lifetime
◇ Pre-charge effect to the lifetime
• Suggestion for lifetime enhancement
◇ Image sticking
• Definition:
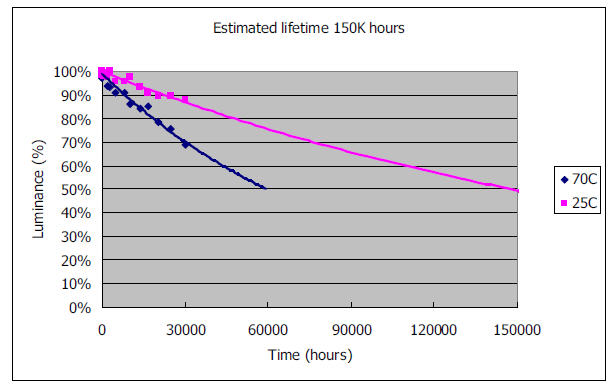
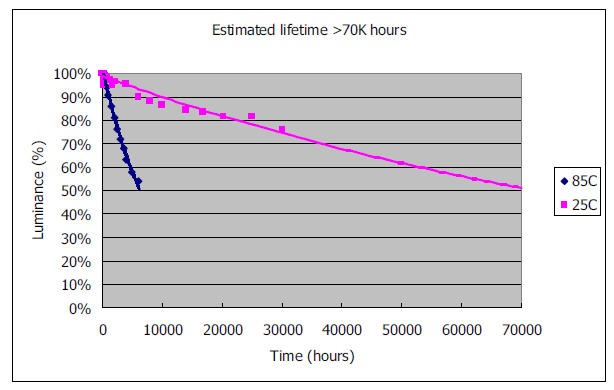
◇ End of lifetime is specified as 50% of initial brightness reached.
• Test Condition:
◇ The lifetime test initial brightness is 80 cd/m2.
◇ The test pattern is 50% on for each pixel. (White/Black/Odd checkerboard/Even checkerboard repeated with 0.5S for each display pattern.)
• Estimation:
◇ Use of high temperature ageing test to determine the“acceleration factor”
Lifetime Test (white color)
Lifetime Test (blue color)
Lifetime Test (green color)
Lifetime Test (yellow color)
Lifetime Test (orange color)
Lifetime Test (full color)

Summary for Lifetime
Effective Factors wiith Liifetiime
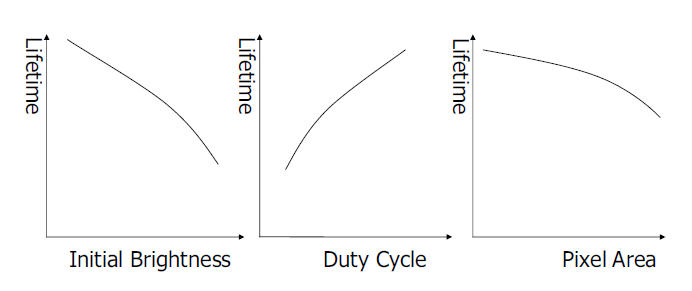
• The most important factor with OLED lifetime is the driving current. Usually, we use following three variable to extend the estimation.
◇ Various initial brightness
• The same duty, and pixel size, but the more bright initial condition,the worse lifetime is.
◇ Various duty cycle
• The same initial brightness, and pixel size, but the smaller duty cycle, the worse lifetime same brightness is.
◇ Various pixel area
• The same brightness, and duty, but the larger pixel area, the worse lifetime is.
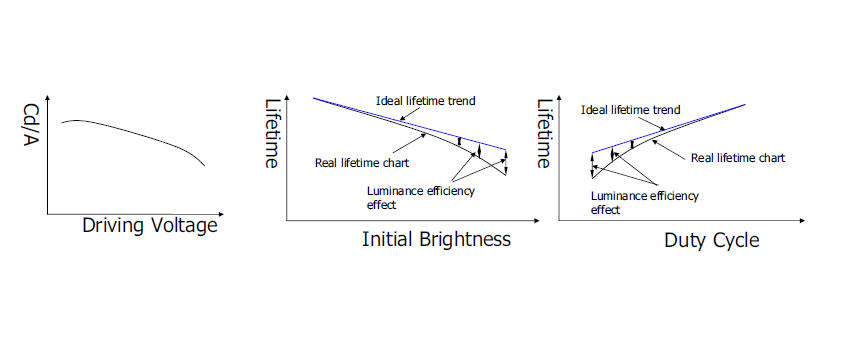
Trend for the Lifetime Evaluation
According to experiment database, we summary the relative chart of lifetime versus initial brightness, duty cycle, and pixel area.
• Luminance Effiiciiency Effect
◇ Please refer the right chart Cd/A v.s.Volts. Increasing the initial brightness will increase higher driving voltage. The lower efficiency need the larger driving current to keep the same brightness, so that the real lifetime is worse and not linear decay as below.
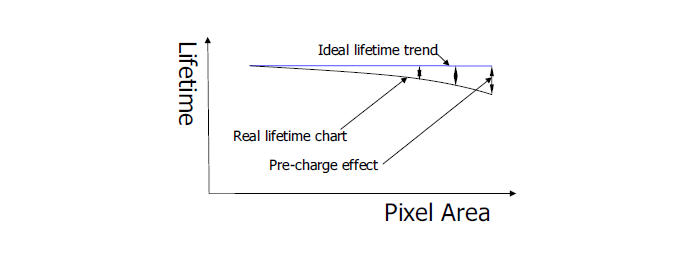
• Pre-charge Effect
◇ The pixel size getting larger, the driving current is getting larger.However, the current density is the same for the same brightness setting.
◇ We assume the ideal lifetime is the same since the current density is the same.
◇ The parasitical capacity is getting large for the bigger pixel size, so that the pre-charge current is larger.
◇ The larger pre-charge current will effect the lifetime as following chart.
• Suggestion for Lifetime Enhancement
◇ Lifetime calculation with working time for full color@80cd/m2.
◇ If we turn on the display 24 hours/day, we will get the lifetime as 15,000/24/365 = ~1.71 years.
◇ If we turn on the display 10 hours/day, we will get the lifetime as 15,000/10/365 = ~4.1 years.
• As our recommendation from lower initial brightness such as 50% off, the lifetime could be double as least.
• Sometimes, when user just shows the timer or some simply message with 8~16 lines on the screen, it is possible to set the high duty ratio, and to reduce the current setting for saving lifetime.
• It's pretty common to use "Screen Saver" to extend the lifetime in real application, especially for image sticking prevention.
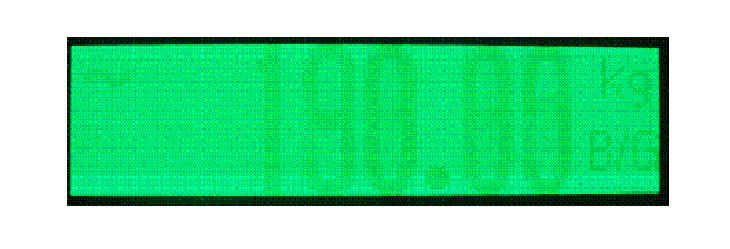
•Each pixel has similar decay rate with the same illuminated time period, but each pixel will have different turned on rate regarding to the display pattern. So the pixels will cause the different luminance decay. If the two closed pixels have different decay and the luminance differential is over 3~5%, it will be distinguished by human eyes. The phenomenon is generally called as “Image sticking/persistence ”, “Burn in/out”, and “Ghost” shown as following photo.
•The way to solve the problem is trying to turn on every pixel with the similar turn on ratio.We will usually recommend the customer using scrolling function for the simplest method, but not useful for every case.
•It is possible to prevent the phenomenon by reducing the banner or large area display on pattern.
The information below is required for social login
Sign In
Create New Account